Riders feel the impact of fleet issues—these 7 metrics help you respond

The right data connects service to outcomes
Transit agencies generate a lot of reports. But not all metrics lead to better decisions. The ones that do are tied to service quality, vehicle availability, and—most importantly—the rider experience.
When maintenance and operations share a clear, real-time view of what’s working (and what’s not), they can act faster, avoid surprises, and keep service on track.
Connect maintenance to service with better data
These seven metrics help agencies shift from reactive maintenance to reliable, data-informed service:
1. Pull-out success rate
What it measures: % of vehicles that leave the depot on time and on the correct block
Why it matters: This is the daily test of fleet readiness. If a vehicle doesn't pull out as planned, trips get missed and riders lose trust.
2. Asset availability vs. Assets needed
What it measures: Number of vehicles available vs. number needed for tomorrow’s service
Why it matters: Helps operations teams plan blocks, assign operators, and reduce overtime. It's also a key indicator of how well maintenance and scheduling are aligned.
3. Mean distance between failures (MDBF)
What it measures: Miles driven between chargeable road calls, broken down by vehicle type or depot
Why it matters: Tells you which platforms are most reliable and where proactive campaigns could prevent breakdowns.
4. Road calls per 100k miles
What it measures: Frequency of road calls, grouped by depot and defect type
Why it matters: Helps target training, inventory, and shop-floor workflows. High rates often signal preventable issues.
5. First-time fix rate
What it measures: % of defects resolved on the first repair attempt, with no repeat within 30 days
Why it matters: Reflects shop-floor effectiveness, diagnostic tools, and technician training. A low rate often means wasted effort and repeated disruptions.
6. Parts stockout rate
What it measures: % of service delays caused by unavailable parts
Why it matters: Tracks how well your inventory and supplier strategy support real-world demand. High stockout rates mean more downtime and higher costs.
7. Rider impact from fleet issues
What it measures: OTP, Missed trips and inconsistent headways tied to vehicle unavailability or defects
Why it matters: Connects internal operations to what riders actually experience. This is the outcome that matters most.
Make the data work
These metrics only matter if they reflect what’s actually happening on the road. That means a shared data model between maintenance and operations.
To get there, teams need:
- Standardized defect codes
- Integrated tools (EAM + CAD/AVL, telematics, scheduling)
- Workflows that make key data easy to access and act on
With the right tools and alignment, teams can ask smarter questions:
- Do we have enough ADA-ready vehicles for tomorrow?
- Are repeat lift issues leading to midday change-outs?
- Will low inventory put weekend service at risk?
Start with early wins
You don’t need a full system overhaul to see results. The fastest way to build momentum is with practical, high-impact changes.
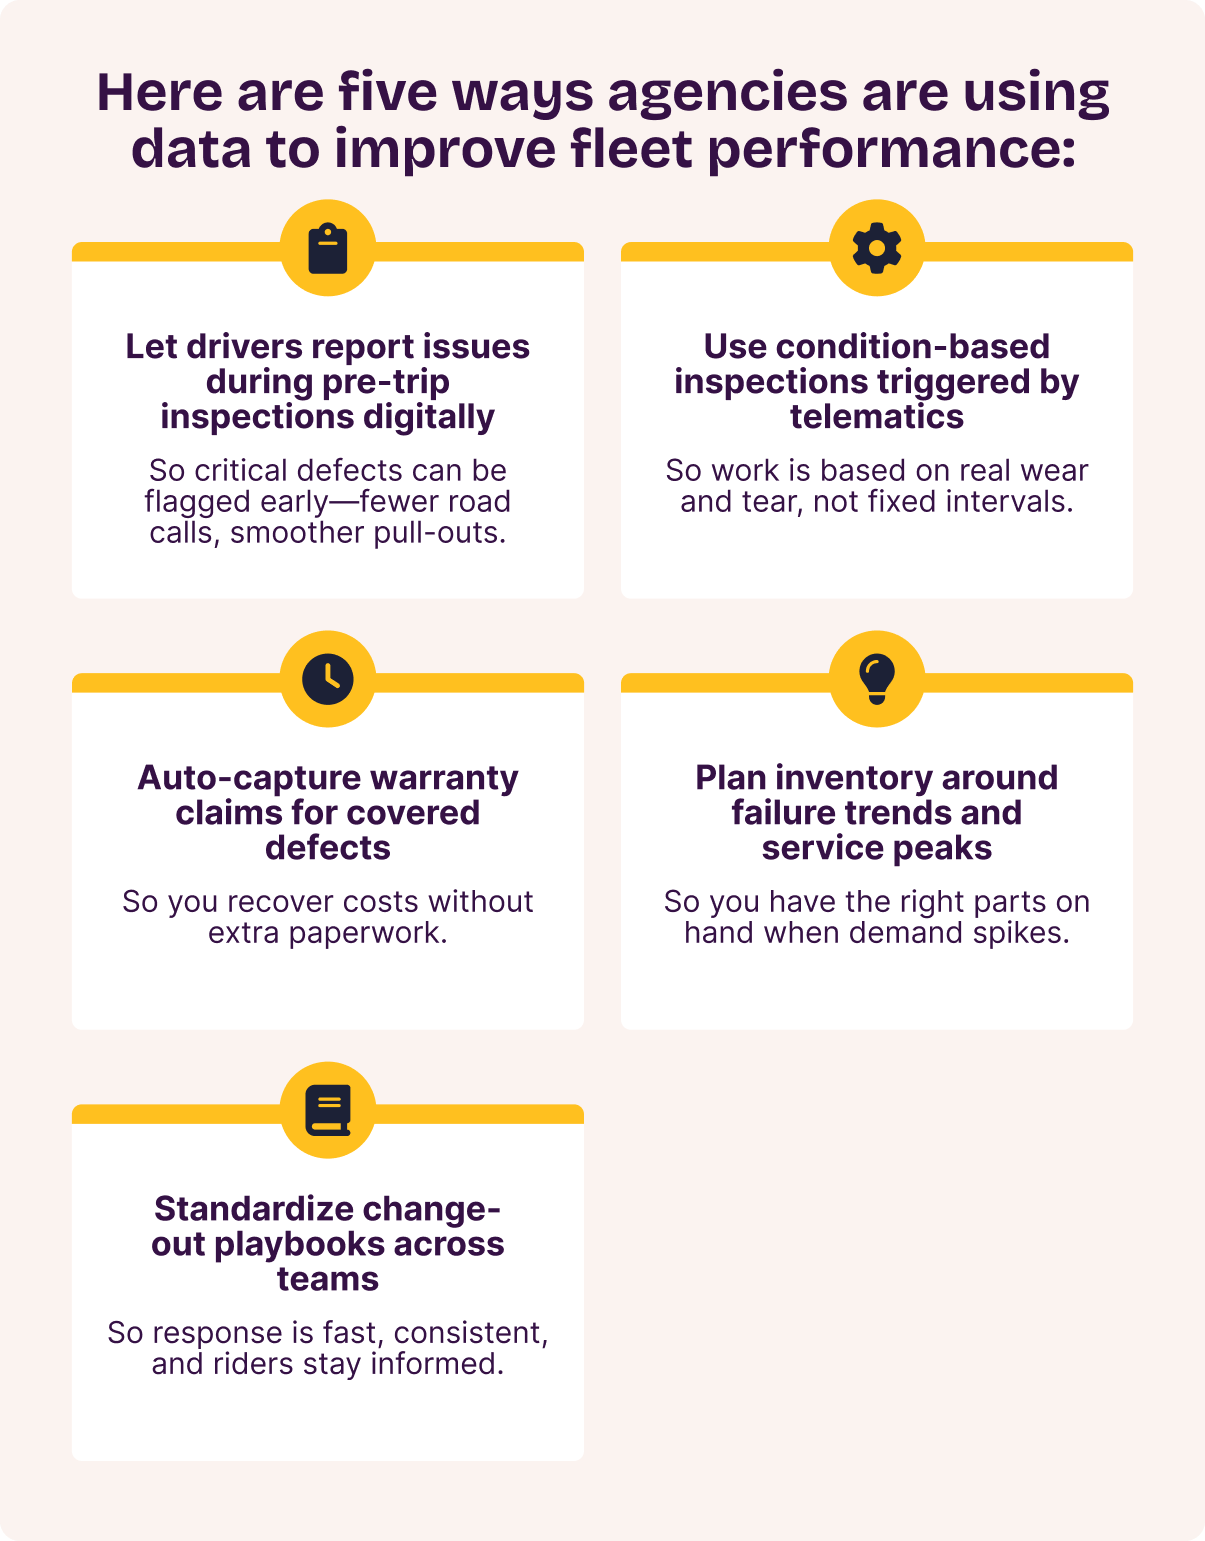
Here are five ways agencies are using data to improve fleet performance:
Build your 90-day fleet maintenance plan
Choose one depot or service mode. Focus on a key season—like winter ramp-up or back-to-school. Use the metrics above to:
- Map your current service day
- Spot where handoffs break down
- Set clear goals, track progress, and share wins
That’s how you build trust in your fleet, one service day at a time.
Ready to close the gap between maintenance and operations?
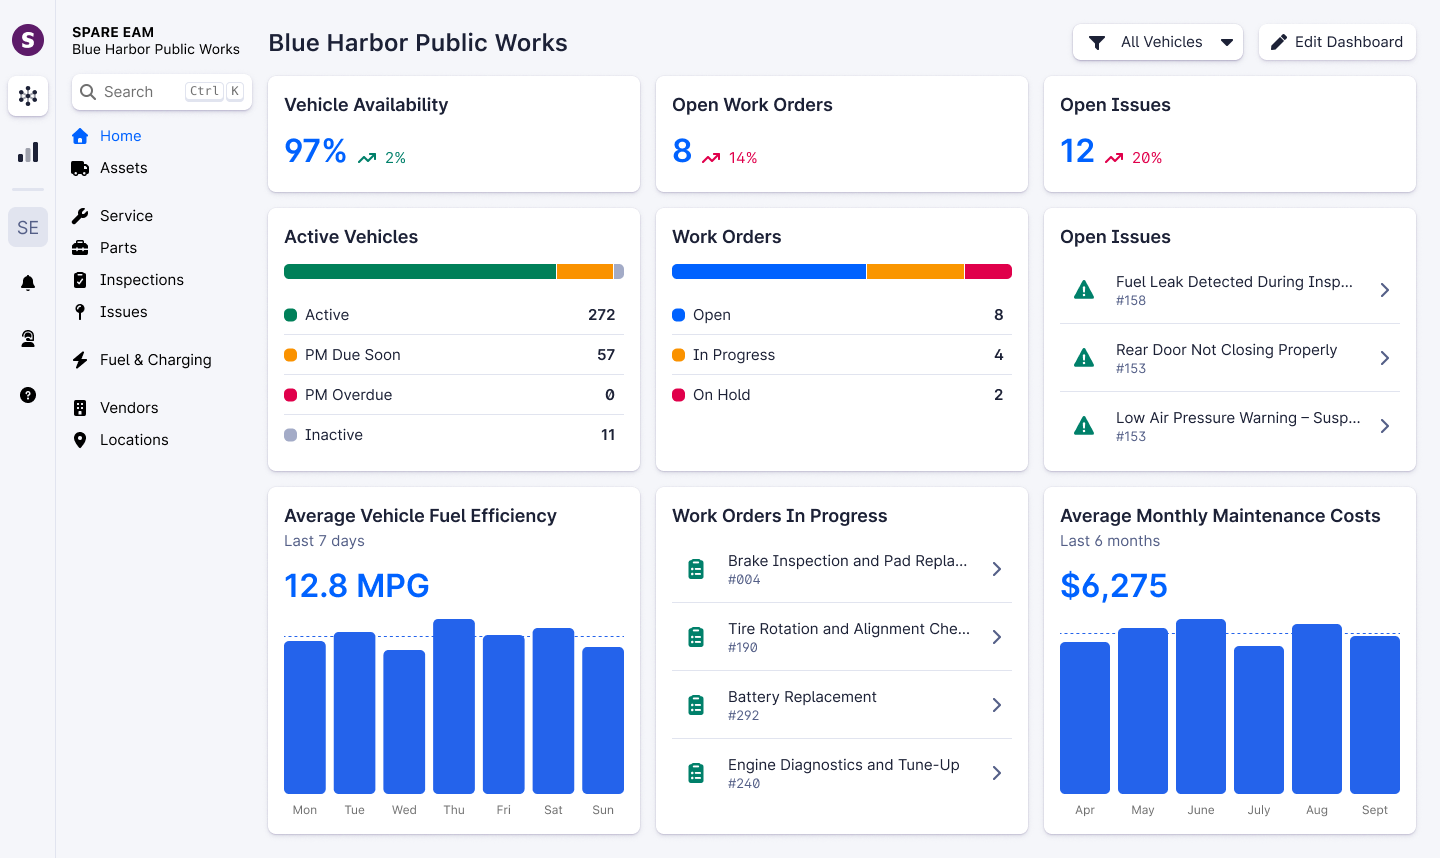
Spare EAM brings maintenance and operations into alignment, so you can deliver safer, more reliable service every day. Get a demo → spare.com/eam

From the blog


“Once we unified dedicated vehicles and TNCs on a single platform, the experience changed immediately for riders. They could see their trip in real time, understand their fare, and know what to expect. From a staff perspective, it eliminated confusion and allowed us to focus on service instead of troubleshooting.”