
How Concho Valley Transit Cut Reporting Time and Boosted Driver Retention

You have to have [all] this data at your fingertips. What used to take an hour now takes about five minutes—and that gives me more time to focus on running the service instead of building reports.

Concho Valley Transit transformed its operations by partnering with Spare to build a custom performance dashboard, with clear goals: turn overwhelming raw data into driver-level insights, create transparency that motivates rather than micromanages, and free up management time for strategic work instead of manual reporting.
Drowning in Data Without Actionable Insights
Concho Valley Transit (CVT) faced an unexpected problem after switching to Spare. While the platform gave them complete access to operational data, the sheer volume was overwhelming, and translating raw numbers into driver-level performance improvements felt impossible.
Ryan Herrera, Assistant Director of Transportation, described the initial struggle:
"When they'll give you all the information you want. But how do you pull that? Well, you got to go pull a pivot table, pull that data. Massive amounts of data."
CVT was drowning in CSV files. Latitude, longitude, pickup times, drop-offs, no-shows. Every data point was available, but making sense of it required hours of manual work.
"I would download these massive CSV sheets and pull that data. Luckily I have an employee that's amazing with pivot tables. I would say pull this for me."
The core problem wasn't lack of data, it was lack of visibility at the driver level. CVT had metrics, but no meaningful way to turn them into action or motivation.
Operating Across a Massive Service Area
CVT's challenges were compounded by geography. Managing performance across 16,000 square miles, with drivers commuting from up to 120 miles away, required better tools than spreadsheets and pivot tables could provide.
From Compliance Burden to Competitive Advantage
What began as a need for better reporting quickly evolved into a tool for engagement and performance improvement.
Recognizing What Drivers Actually Wanted
Ryan discovered something critical: high-performing drivers wanted to see their own metrics. When shown data about their efficiency—trips per hour, on-time performance, passenger grouping—they became more engaged, not defensive.
"The drivers, they see that and like, well, hey, look, I want to be the driver of the week, you know, and that's what we use the dashboard for."
But CVT needed a way to make this data accessible, not just to management, but to drivers themselves.
Building a Custom Dashboard
Rather than waiting for an off-the-shelf solution, Ryan worked directly with Spare's product team to design exactly what CVT needed.
"I told them this is what I need to monitor my drivers on a weekly basis, on a daily basis. And we do that. We go in there, we're able to pull up our dashboard and see what drivers are performing. Who are the top 10."
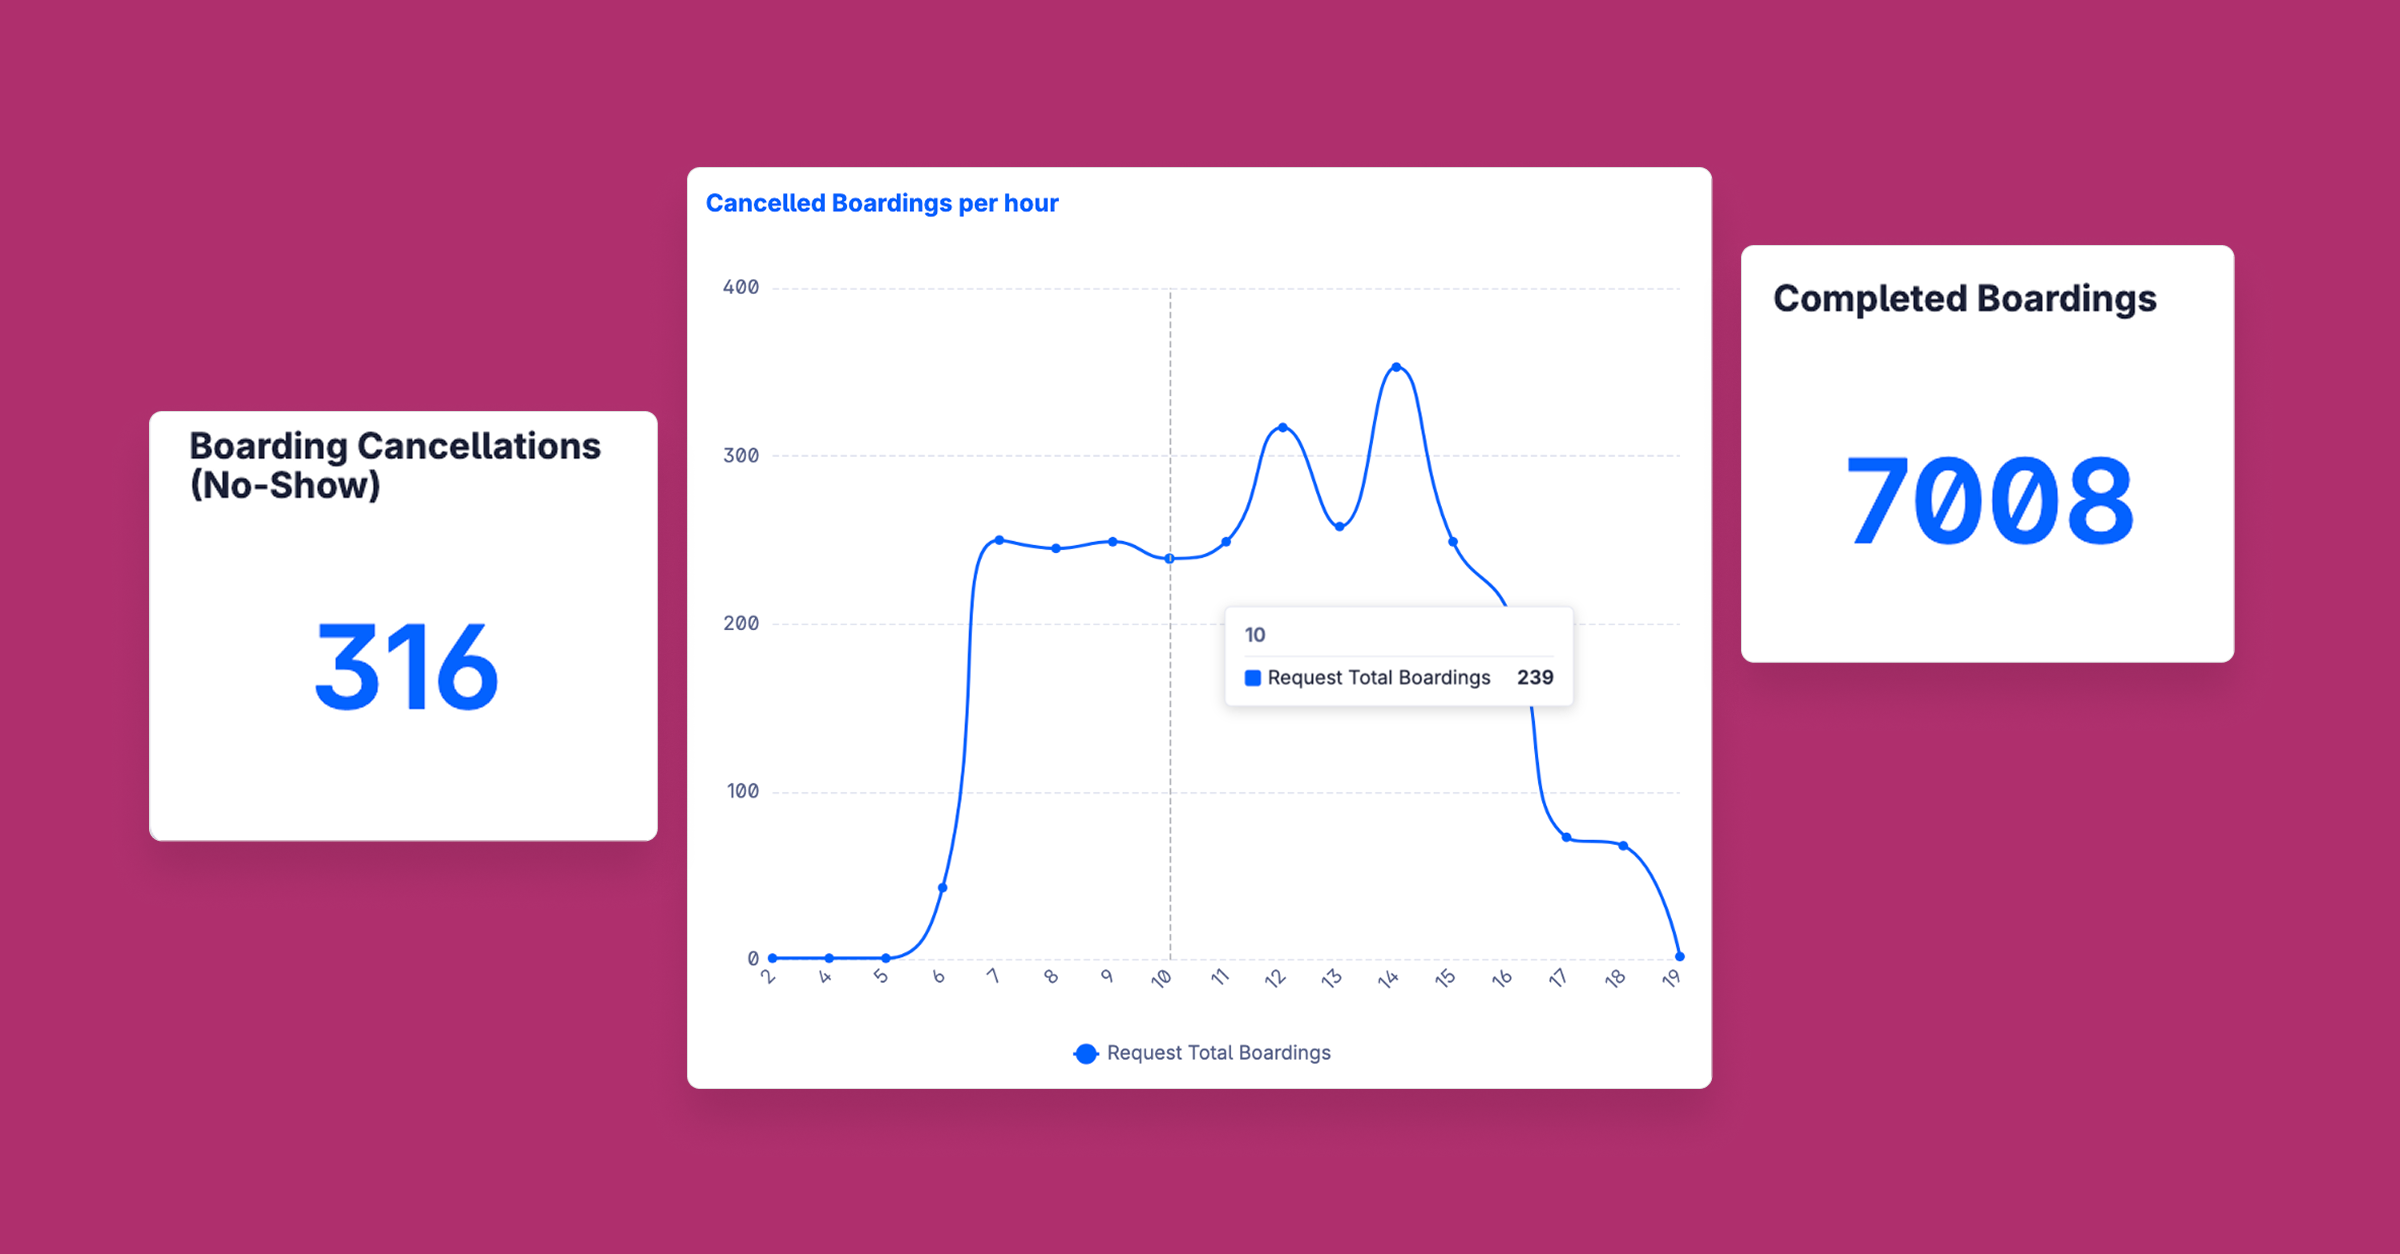
The dashboard displays real-time performance metrics:
- Trips per hour (target: 3 PPH for efficient operations)
- On-time performance (industry standard: 92%)
- Individual driver leaderboards (weekly rankings)
- No-show tracking (automated suspension after 3 no-shows)
- Weekday vs. weekend performance (separate rankings based on availability)
The key was simplicity:
"I click on it. Bam. And I can see right there, my top 10 drivers or my drivers, where they're at. Every driver that has worked in the past 30 days and the date range."
Turning Analytics Into Competition
What transformed the dashboard from a management tool into a performance accelerator was making it visible to drivers. CVT posted rankings on a physical board at the depot.
"At the depot, the supervisor has a board and it has all the drivers. Wally, he moved 22 passengers. He was at 97% [OTP] and he moved like 2.85 passengers per hour. It's great, you know, like, I want, I want. We want everybody to be above 2."
The competitive element drove engagement:
"They can see where they're at on a daily basis. Hey, look, I'm solid for this quarter. I'm gonna get my bonus."
Measurable Impact on Retention and Performance
The shift to real-time performance visibility didn’t just improve reporting. It reshaped retention, incentives, and operational planning.
From High Turnover to Industry-Leading Retention
CVT went from struggling with turnover to achieving retention rates that are rare in the industry, especially impressive given that drivers travel from across a 16,000-square-mile service area.
"I don't have high turnover where I'm at. I did before I got there. But everybody that I've been there with, I mean, like, I don't have drivers quitting. I've got drivers that have been there 10, 15 years."
The dashboard transformed what used to take hours into minutes:
"It's the first time I've gotten an S-10 report done in 30 seconds. Bam."
The time savings extended beyond compliance reporting to board presentations:
"That's part of the whole circle there is the engagement, the being open and letting them know how they're performing. You know, like, hey, look, you know where you were? You ranked at 75, you're at 80. Hey, what can we do to get you up? Let's boost you, you know."
Tying Metrics to Real Compensation
CVT implemented a quarterly incentive program tied directly to dashboard metrics:
"We have driver incentives. Hey, the safer you are, the more productive you are. You're going to get this safety bonus. You're going to get this incentive bonus."
The metrics encompass safety, reliability, and customer service. Not just raw productivity.
Operational Forecasting and Scheduling
Beyond driver motivation, the dashboard enabled smarter resource planning.
"When we book the day before, we take a look at the trips the next day. I know that my heavy hour is always going to be around 6:00am. So if I've got 27 trips and I'm assuming my drivers are able to move three passengers per hour, how many drivers am I going to need? So then I take that and like, hey, I need at least nine drivers to perform these trips."
This forecasting capability helps CVT avoid service denials, a critical FTA compliance metric.
What Makes This Different
For CVT, the dashboard was not just a convenience. It became foundational to how they operate.
The Cost of Not Having It
When asked what would happen without the dashboard, Ryan was emphatic:
"It's detrimental. That is a key factor in operating a transit system. You have to know... if you weren't able to do that for me, I might be looking for a different company. You have to have this data at your fingertips."
The alternative of going back to manual methods was unacceptable:
"Nobody wants to go back to the old ways because time is everything. I get more time to perform my duties. I get more time to provide oversight. I get more time to engage my drivers than sitting there at a desk, pen and paper."
Time Savings That Freed Up Strategic Work
The dashboard transformed what used to take hours into minutes:
"Something that took me an hour to put together [PowerPoint presentations for the board], now is only taking me five minutes. That's where it's at. It gives you back more of your day."
With reporting automated, CVT could focus on higher-impact work:
"Now I can concentrate on safety. I can concentrate on passenger engagement. I can concentrate on regional coordination, getting out in the public and letting the public know what it is we do."
Lessons for Other Agencies
CVT’s experience offers practical guidance for agencies looking to turn operational data into measurable performance gains.
Understanding Your Data Needs First
Ryan has become an informal advisor to other agencies exploring Spare. His advice centers on knowing what you're trying to accomplish:
"I tell them we are the full gambit... I ask what does your agency do first? Or we just do rural, or we just do urban demand? Perfect. Everything is great."
The Reality Check on Reporting
"The reporting at first, you have everything you want. You just have to make sure you're really good at pivot tables, really good at pulling data because they will give you every piece of data that you want... It is a lot of data."
The Power of Partnership
"Everything that I've asked for, I've gotten it. You just have to know what you're looking for... I tell them it would be really cool if I could get like something that would pull up my trips per hour, my OTP, you know, all this data. I can do something like that for you. And they've done it."
.png)
The critical success factor was customization:
"Whatever your organization wants, however it's going to benefit you, that's what it comes down to. You know, like, hey, we're here, Spare's here to help cater to your organization."
A Shift Toward an Analytics-Driven Culture
CVT's transformation wasn't about having more data. It was about using data to create transparency, fairness, and engagement at the driver level.
By visualizing KPIs on a depot board and tying them to quarterly bonuses, CVT created an environment where drivers wanted to improve. The real differentiator wasn't the technology, it was using the technology to drive behavior change.